fbpx
Skip to content
shockdyno
WHAT IS A SHOCK DYNO?
 
There is a wealth of misinformation on the Internet and forums concerning shock dynos. First we must understand that a shock dyno is not the quintessential element of ride quality and performance.
 
A Shock dyno is only a tool to help determine how good a shock is in theory. Real world testing is also necessary to determine how a shock rides and performs. Shock dyno results primarily aid in determining hysteresis & cavitation. We also use a shock dyno for shock matching, durability tests and confirming damper adjustments. At Fortune Auto North America we use a shock dyno in our daily operations for all of these tests. This helps us offer the client a consistent and thoroughly tested product.
 
Many manufacturers shy away from displaying shock dynos because either they do not have have access to a dynometer or they may be trying to hide their shocks’ characteristics. When we build all of our shocks we use a CVP graph to confirm that the shock was built properly. At Fortune Auto you can request a shock dyno when purchasing your shocks for an additional $100. We supply you with a PVP sweep graph. We normally do not provide this service free of charge because it takes about 45 minutes per shock to conduct a PVP sweep graph.
 
CVP SHOCK DYNO PLOT:
 
This plot helps a shock builder or manufacturer determine if a newly assembled shock is performing within its defined parameters. It also helps determine if there is excess cavitation (usually due to lack of nitrogen pressure) and more importantly hysteresis.
 
Hysteresis is shown by the separation of the 2 lines in the graph and is the result of seal drag. Generally a shock with extremely low seal drag (a good thing for performance) has a lower life span and will need to be rebuilt more often. A shock with higher seal drag (think oem strut) can go longer with out rebuilds. Its important to find a balance between the two. A damper exhibiting a good balance between low hysteresis & seal drag generally requires rebuilding every 2-5 years.
 
The graph below is of a Fortune Auto shock. The minimal gap between the 2 lines shows fairly low hysteresis. This test was conducted at 250 degrees, the maximum heat that would be seen on a race or drift car.


Shock Dyno Basics

The graph below is of a competitors shock that is similarly priced to ours. This damper exhibits poor shock operation and is unacceptable in terms of hysteresis. Its actually worse then an oem shock. This shock was also tested at 250 degrees.
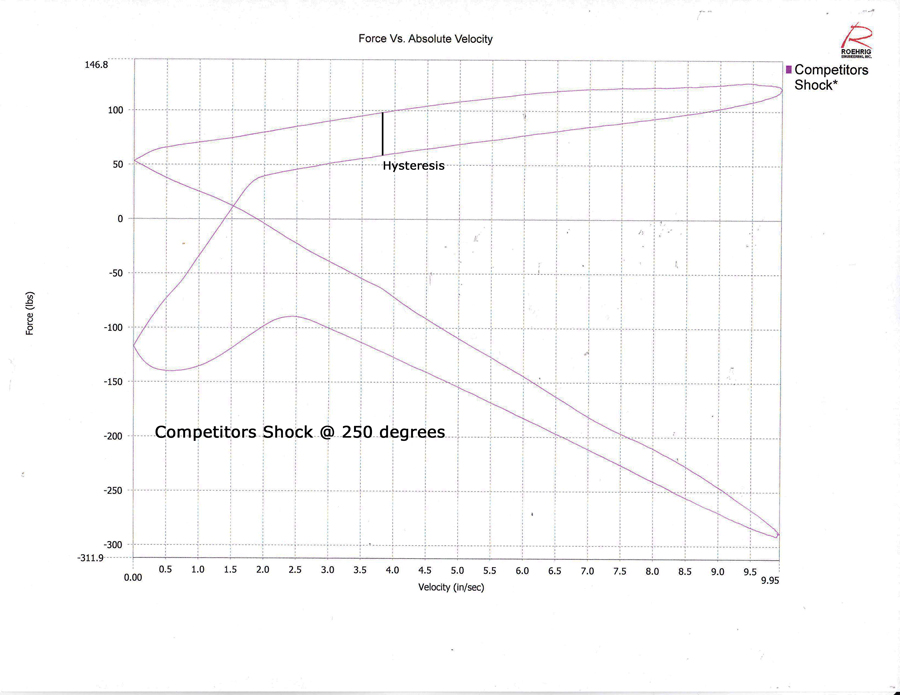
Comp shock @ 250
PVP SHOCK DYNO PLOT:  
 
At Fortune Auto we like to use the PVP plot in determining the ride quality and ride performance of a shock. It also helps determine how linear or digressive a shock is.
 
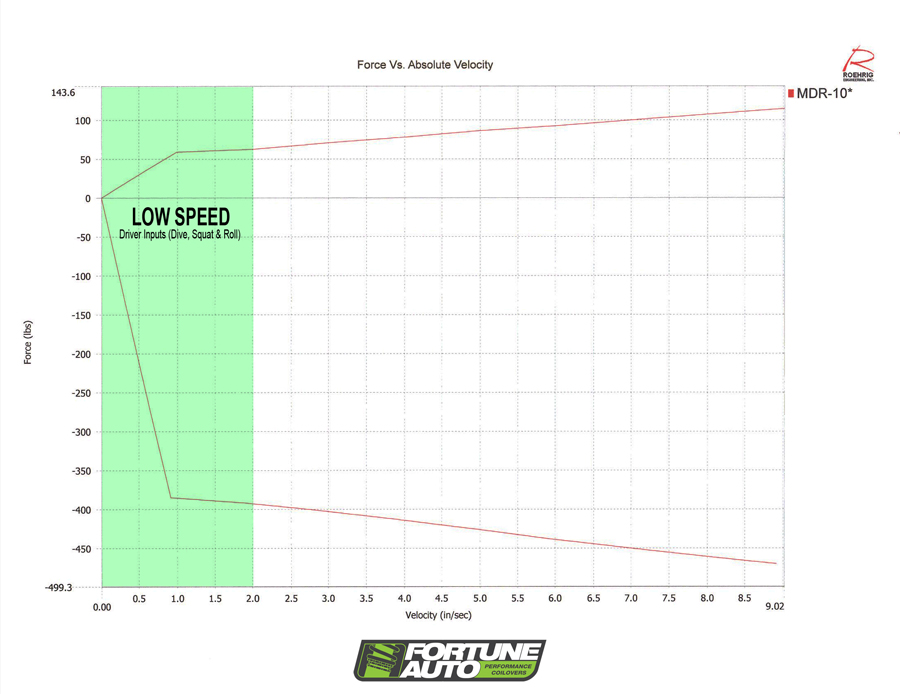
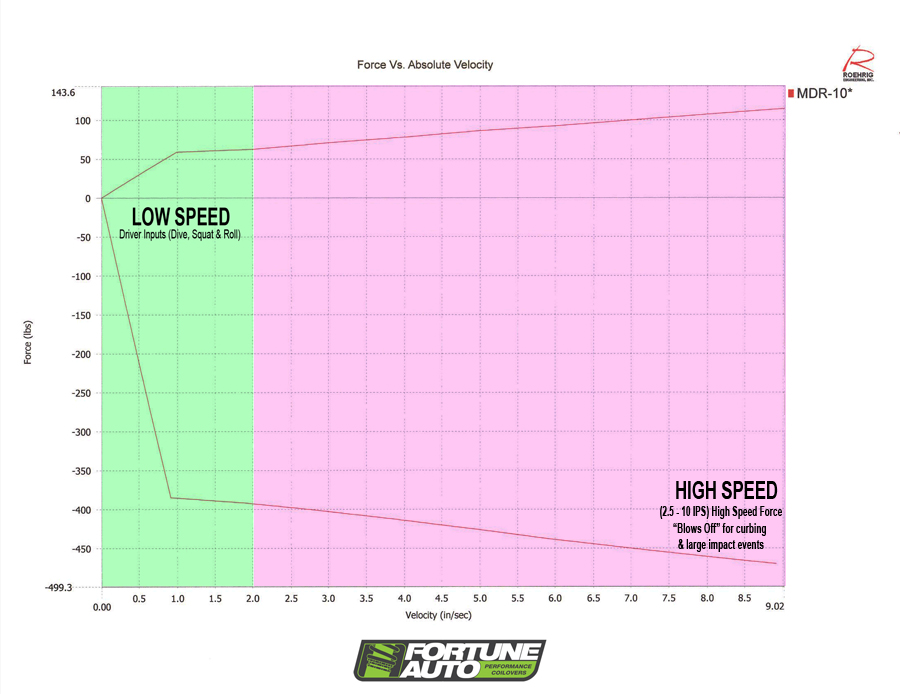
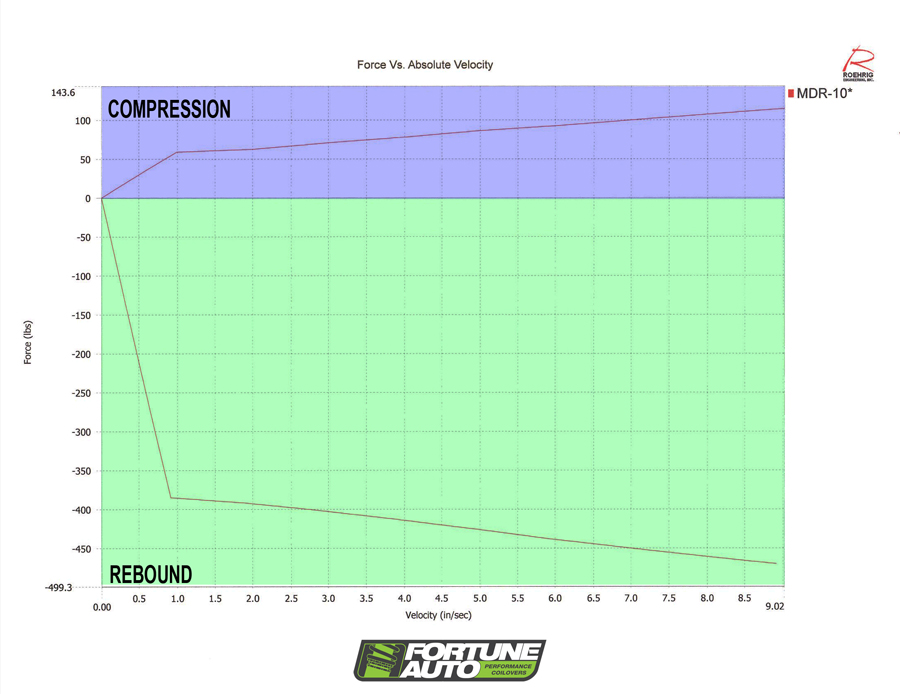
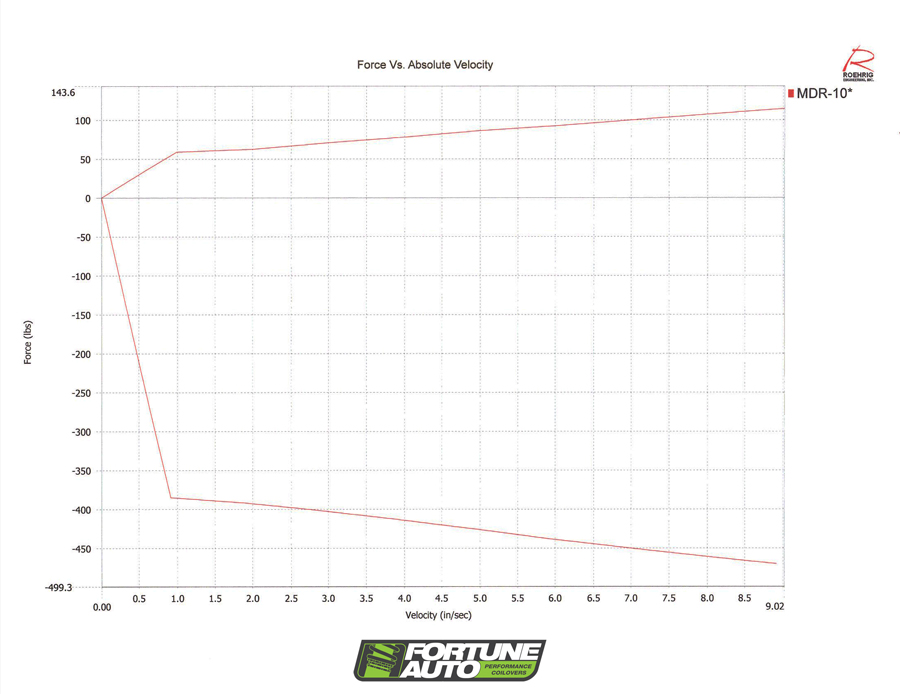
Below is a graph of a 510 damper. The graph is separated into 4 quadrants. The top of the graph displays compression force and the bottom of the graph displays rebound force. The left side of the graph represents low shaft speed and the right side represents high shaft speed. A common misconception of the low speed and high speed variables is that the measured velocity is referring to the speed of the car. Low shaft speed represents driver inputs such as roll, pitch, squat and dive. High shaft speed represents bumps, pot holes, rumble strips etc.


EPSON MFP image
EPSON MFP image
EPSON MFP image
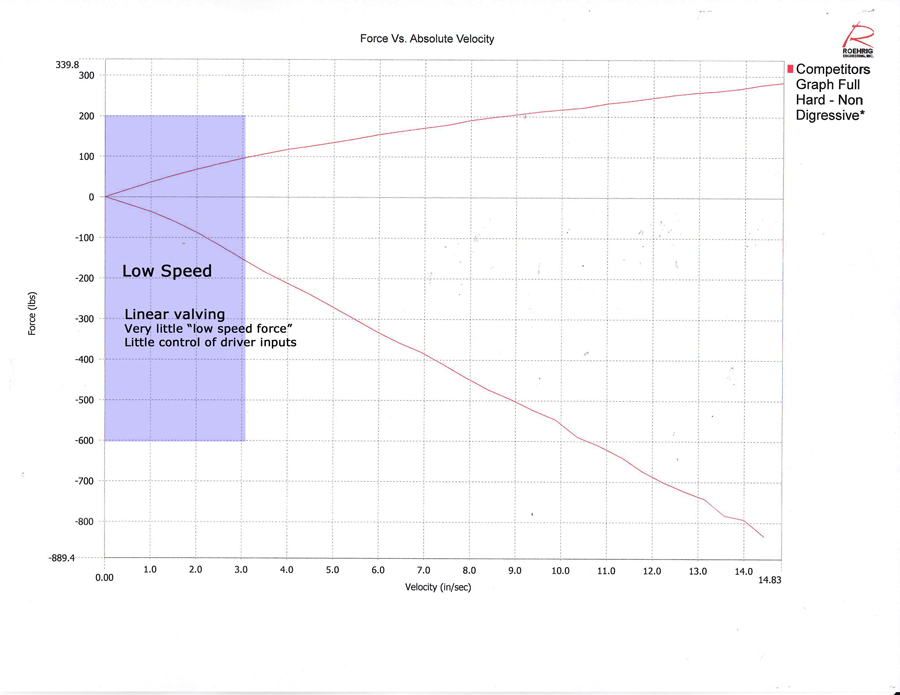
High shaft speed results will generally give you an idea of how comfortable a shock is and low shaft speed results help give the driver confidence. A linear shock has very little low speed force and will not handle roll, pitch, squat and dive situations as well as a digressive shock that has greater lower speed force.
 
Generally everything under 2-3 inches per second is considered low shaft speed and anything over 2-3 inches per second is considered high shaft speed. The graph below is of a linear shock. Again this shock is a competitor’s shock. As you can see there is very little low speed force.


Comp shock low speed

The graph below is of a 510 series shock. As you can see the graph has a knee in it. The shock exhibits much lower shaft speed force…again more control in roll and dive/squat situations.
EPSON MFP image
FORTUNE AUTO SHOCK DYNO GRAPHS:
 

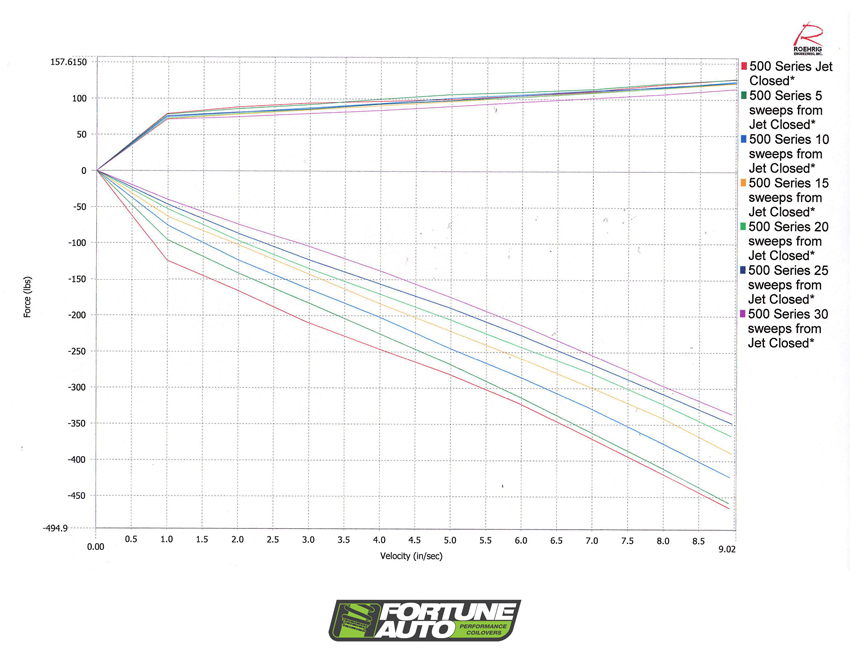
Below is a sweep PVP graph of one of our 500 series shocks from full soft to full hard. You will notice nice consistent damping changes. Many lesser shocks make little to no damping changes when the knob is turned.
Fortune Auto 500 Shock Dyno a
CONSISTENCY AND REPEATABILITY:
 
 
It is important that a shock is tested once, tested again, and then tested some more. When we dyno a shock we dyno all of them at 90 degrees. This makes all of our tests consistent for comparison.
 
However race/drift conditions can actually get a shock extremely hot. We have seen temps as high as 220 degrees on our race cars after 40 minute wheel to wheel races. Usually a shock’s characteristics will drastically change when it sees higher temps. This is due to small piston sizes, low quality shim stacks and non synthetic shock oils that tend to cavitate and fade.
 
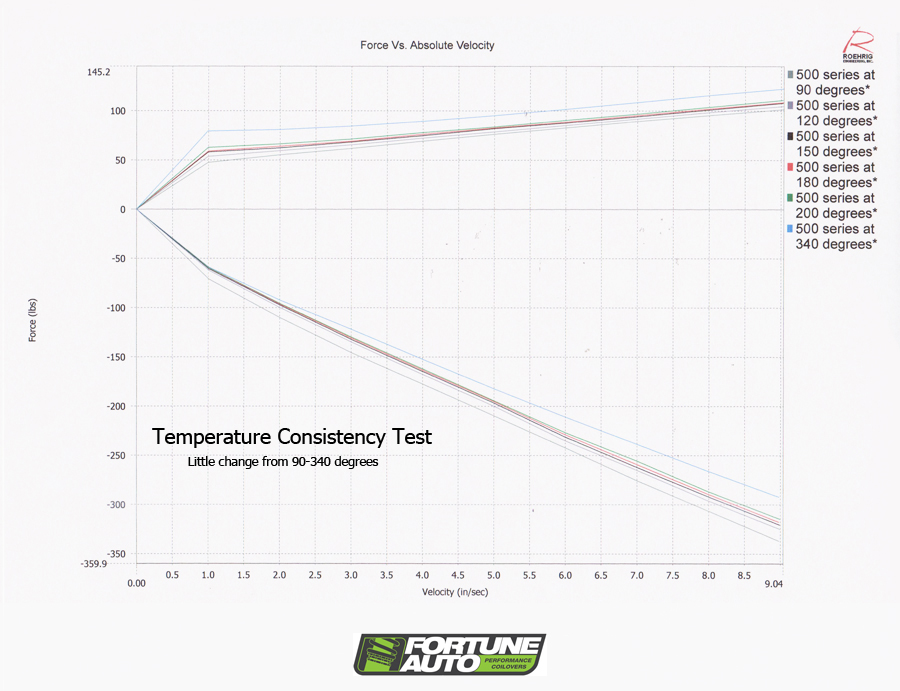
We are proud to announce that our shocks are extremely temperature resistant. The graph below shows our shocks running through extreme temperatures. The graph shows how resilient our shocks are to massive temp changes.
FORTUNE AUTO SHOCK DYNO consistency

Considering that an egg will fry at 160 degrees Fahrenheit, it is pretty impressive that our shocks perform virtually the same at 90 degrees Fahrenheit as they do at 340 degrees Fahrenheit. This is accomplished by running over-sized shock bodies that hold more shock oil, high quality shims and heat resistant synthetic oil.
 
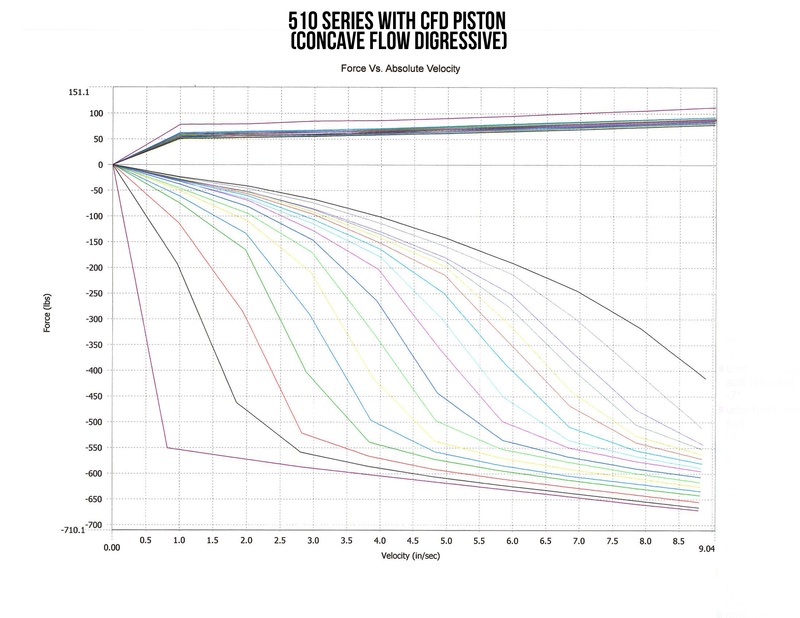
Lastly lets take a look at a shock dyno graph that is very digressive. More low speed force that tapers off in the high speed quadrants for a less jarring ride.  Less rebound force in the high speed area of the graph translates into more mechanical grip when going over uneven track surfaces or berms.
EPSON039-1

Sweep graph of the “Ultra” Digressive 510 series shock.

Back to top